Functional Data Analysis (FDA) is a branch of statistics that focuses on analyzing data that are functions, curves, or trajectories rather than scalar observations. Many real-world phenomena are better represented as continuous functions, such as growth curves, temperature profiles, stock prices, or physiological signals. FDA provides methods for exploring, modeling, and interpreting such functional data, capturing underlying patterns and trends that traditional scalar-based techniques may miss. The approach is widely applied in healthcare, finance, environmental science, engineering, and social sciences, offering robust insights into dynamic systems.
Table of Contents
Understanding Functional Data
Functional data are observations that vary over a continuum, typically time or space. Key characteristics include:
- Continuity: Observations are often collected continuously or densely over time or another domain.
- Smoothness: Functions exhibit smooth trends, though they may contain local fluctuations or noise.
- High Dimensionality: Representing functional data often involves many points, making dimensionality reduction essential.
- Correlated Observations: Values at nearby points in the domain are often correlated.
Examples of functional data include:
- Growth trajectories of children over time.
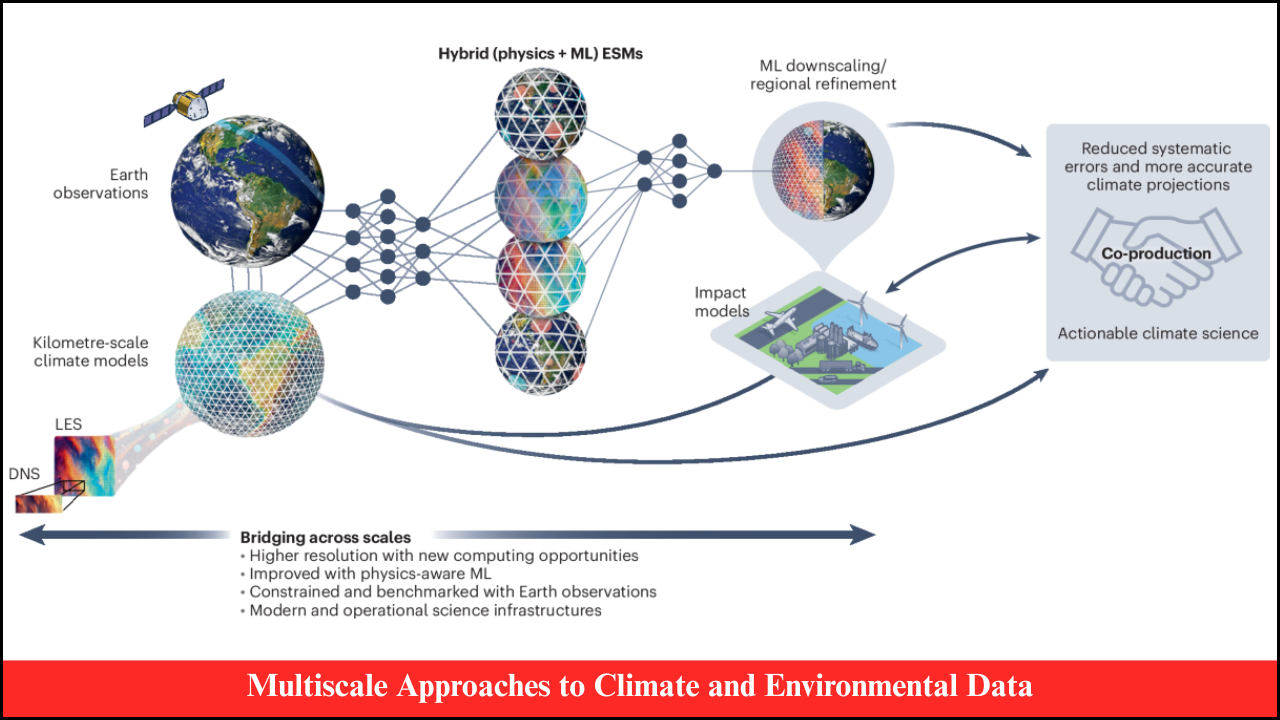
- Daily temperature or precipitation curves in climate studies.
- Electrocardiogram (ECG) signals in healthcare monitoring.
- Financial asset prices over a trading period.
Key Techniques in Functional Data Analysis
- Smoothing Methods:
- Convert discrete observations into smooth functions using basis expansions such as B-splines, Fourier series, or wavelets.
- Reduce noise while preserving underlying patterns.
- Functional Principal Component Analysis (FPCA):
- Reduces dimensionality by identifying principal modes of variation in functional data.
- Captures dominant patterns across multiple functions.
- Functional Regression:
- Models relationships where predictors, responses, or both are functions.
- Includes scalar-on-function, function-on-scalar, and function-on-function regression.
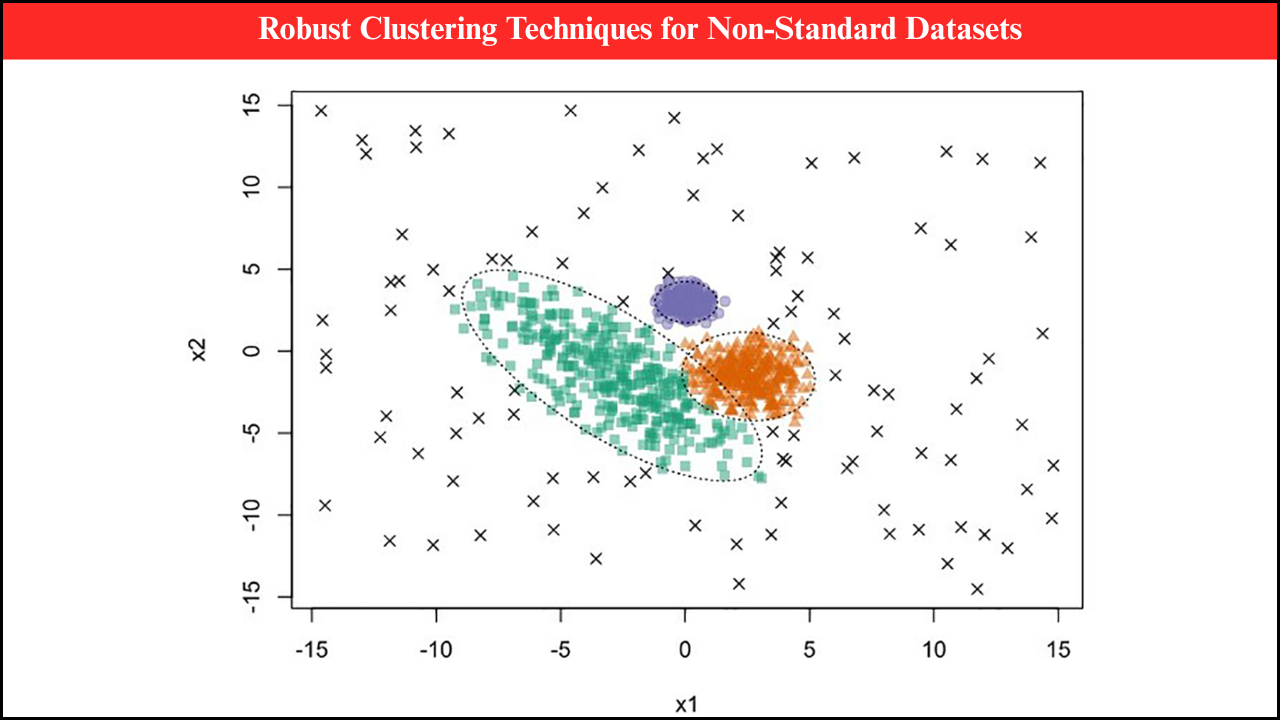
- Functional Clustering:
- Groups similar functional observations to detect patterns or categorize behaviors.
- Useful in segmenting patients, climate profiles, or financial trajectories.
- Functional Classification:
- Assigns functional observations to predefined categories using methods adapted from discriminant analysis or machine learning.
- Functional Hypothesis Testing:
- Tests for differences between groups or trends in functional data.
- Includes functional t-tests, permutation tests, and functional ANOVA.
Applications of Functional Data Analysis
| Domain | Functional Data Type | Techniques Applied | Outcome |
|---|---|---|---|
| Healthcare | ECG, EEG, growth curves | Smoothing, FPCA, functional regression | Early disease detection, patient risk profiling |
| Finance | Stock prices, interest rate curves | Functional regression, FPCA | Trend analysis, portfolio risk modeling |
| Climate Science | Temperature, precipitation curves | Smoothing, functional clustering | Detection of climate patterns and anomalies |
| Industrial Engineering | Machine performance over time | Functional PCA, functional monitoring | Predictive maintenance, anomaly detection |
| Social Sciences | Longitudinal survey responses | Functional regression, clustering | Understanding behavioral trends over time |
Case Studies in Functional Data Analysis
- Monitoring Heart Health
- Data: Continuous ECG signals collected from patients.
- Method Used: Functional PCA to identify abnormal cardiac patterns.
- Result: Early detection of arrhythmias and other cardiac conditions, supporting timely medical interventions.
- Financial Market Analysis
- Data: Intraday stock prices across multiple assets.
- Method Used: Functional regression to model relationships between market indices and individual asset trajectories.
- Result: Enhanced prediction of price movements and portfolio optimization strategies.
- Climate Pattern Detection
- Data: Daily temperature curves over several years.
- Method Used: Smoothing and functional clustering to identify similar temperature profiles.
- Result: Classification of climate zones and detection of anomalous heatwave patterns.
- Industrial Equipment Monitoring
- Data: Machine sensor readings over operating cycles.
- Method Used: Functional PCA for dimensionality reduction and anomaly detection.
- Result: Early identification of malfunctioning equipment, reducing downtime and maintenance costs.
- Longitudinal Social Research
- Data: Survey responses tracking behavioral changes over time.
- Method Used: Functional regression and clustering to explore trends.
- Result: Insights into population-level behavior shifts and the impact of interventions.
Advantages of Functional Data Analysis
- Captures Continuity: Preserves the temporal or spatial structure of data.
- Handles High Dimensionality: Reduces complexity while retaining meaningful patterns.
- Flexibility: Applicable to scalar, functional, or mixed data types.
- Improves Predictive Accuracy: Incorporates the full functional structure rather than just snapshots.
- Facilitates Interpretation: Identifies dominant modes of variation and group differences clearly.
Challenges in Functional Data Analysis
- Computational Complexity: High-resolution functional data can require substantial processing power.
- Data Preprocessing Needs: Requires careful smoothing, alignment, and handling of missing values.
- Choice of Basis Functions: Selection of appropriate basis functions (splines, Fourier, wavelets) is crucial for accurate modeling.
- Interpretability: Functional regression and clustering can be harder to interpret compared to scalar methods.
- Scalability: Handling massive functional datasets remains a technical challenge.
Technological Tools for Functional Data Analysis
- R Packages:
fda,refund,funFEM,fdapacefor functional regression, PCA, and clustering. - Python Libraries:
scikit-fda,FDApyfor functional data preprocessing, modeling, and visualization. - High-Performance Computing: Required for large-scale functional datasets or high-dimensional functional PCA.
- Visualization Tools: Advanced plotting libraries to visualize curves, modes of variation, and cluster structures.
Future Directions in Functional Data Analysis
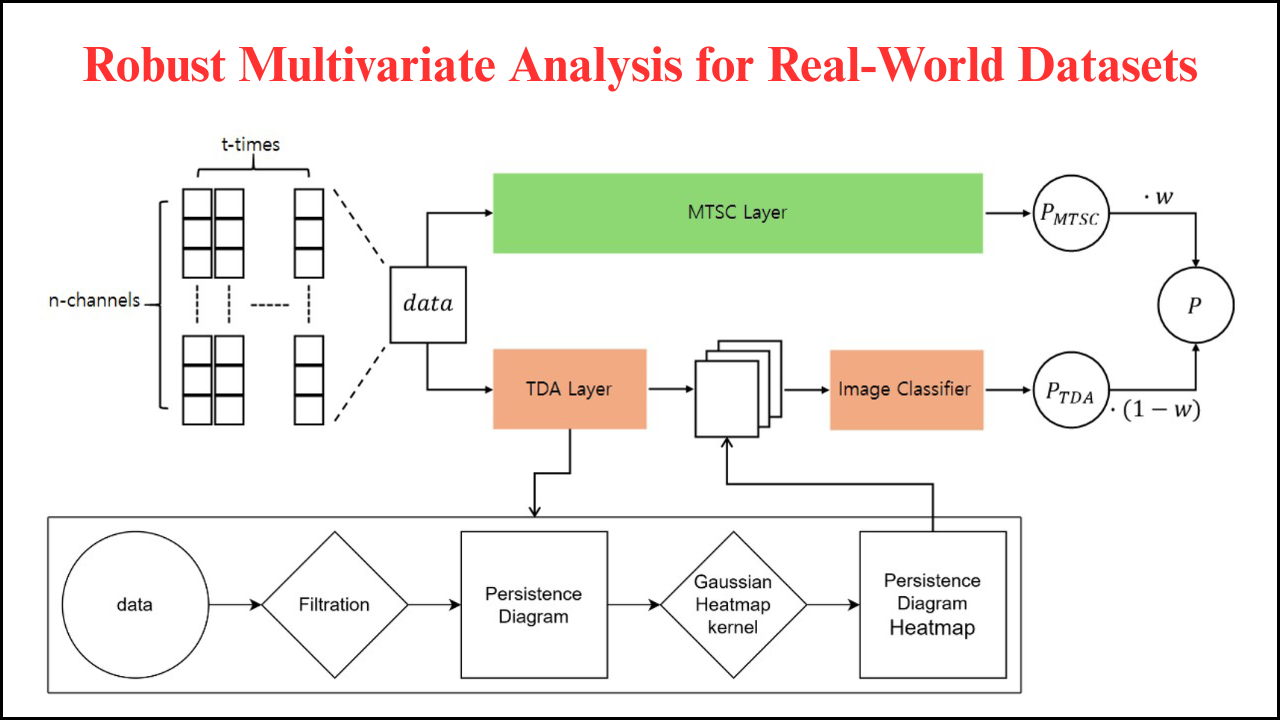
- Integration with Machine Learning: Combining FDA with deep learning for complex functional datasets like imaging, video, and multivariate sensor data.
- Functional Data in Real-Time Monitoring: Applying FDA for streaming data in healthcare, finance, and industrial IoT systems.
- Robust Functional Methods: Developing techniques resilient to outliers, missing data, and noise in functional observations.
- Multidimensional Functional Data: Extending FDA methods to surfaces, tensors, and higher-dimensional functions.
- Cross-Domain Applications: Leveraging functional data techniques across environmental science, social networks, genomics, and personalized medicine.
End Notes
Functional Data Analysis provides a powerful framework for analyzing complex data represented as continuous curves, trajectories, or surfaces. Techniques such as smoothing, functional PCA, regression, clustering, and classification enable researchers and practitioners to extract meaningful patterns, detect anomalies, and make accurate predictions. Case studies in healthcare, finance, climate science, industrial monitoring, and social research demonstrate the versatility and effectiveness of FDA. As computational tools, real-time data collection, and interdisciplinary applications expand, functional data analysis will continue to play a crucial role in transforming complex datasets into actionable insights across diverse fields.